Thursday, May 19, 2011

Mathematica CDF documents

This is my first Mathematica cdf document on the Internet.
The most remarkable feature of a cdf document is that it can be posted on a web site and evaluated by anybody with a web browser and the freely available cdf player plugin.

Graph demo
Note.- Unfortunately, it only works on Windows and Mac.
Friday, May 13, 2011

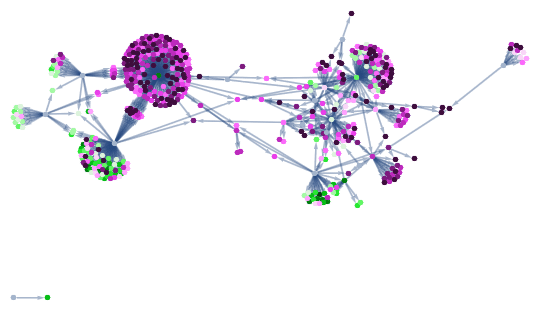
Bibliographic Graphs Time-Line

Different colors for different publication dates. Dark green for the oldest to dark purple to the latest
  • Key word: Bures measue

  • Key word: Haar measure 

Tuesday, May 10, 2011

Bibliographic Graphs

Continuing with bibliographic graphs.
Here I combine the graphs from the Bures measure in green and the Haar measure in red, where the publications that are common in both are in orange

Sunday, May 8, 2011

Bibliographic Graphs

I just made a Mathematica program to generate the citation graph for scientific academic publications given a specific keyword (and some upper limit on the number of publications to treat). Some examples for three areas of my own interest are shown below
  • Key word: "Bures measure"
  • The same job done for  "Haar measure" 
It seems that the research done for the "Haar measure" is made of several unconnected niches. However, I expect that they will find some connection as I let the program run for more time.

  • One final example for "Quantum control"

Bibliographic research is now easier because I can put the mouse on the top of each node and see what paper is that. Something nice would be to output the whole bibtex file.

Acknowledgements: This program was made possible thanks to the help of my friend Josh Greig.

Sunday, May 1, 2011

Extracting data from a pdf file

There are a few quite expensive commercial programs for extracting data from pdf files, but a few lines of Mathematica code may be able to do the job for most cases. For example, the following file with  many pages
results in the following table
Note.- This method works for text-searchable pdf files. Otherwise, this would be an image processing job.

Thursday, April 21, 2011

Mathematica as a C code generator

Mathematica is able to generate C code ready to be compiled and ultimately capable to produce a stand alone executable file. Nice !. There are restrictions on the extent of what can be be processed in this way but it can be really useful in practice as it is right now.

The generation of the executable can be done within Mathematica or outside Mathematica. The Mathematica 8.0 help for my Linux Fedora 64bits requires a minor adjustment in order to work. For Linux systems:

"Libraries" -> "WolframRTL_Static_Minimal.lib"

must be replaced by

"Libraries" -> "WolframRTL_Static_Minimal"


(Thanks to Abdul Dakkak for helping on this)

How do we compile the generated code outside Mathematica? This issue is detailed next


  •  The Mathematica code that generates the C code for a simple example taken from the help is

code =
  CProgram[
   CInclude["stdio.h"],
   CInclude["compute.h"],
   CFunction["int", 
    "main", {{"int", "argc"}, {"char", 
      CDereference[CArray["arg", {}]]}},
    CBlock[{
      CDeclare["double", CAssign["num1", 20.4]],
      CDeclare["double", "num2"],
      CDeclare["WolframLibraryData", 
       CAssign["libData", 
        CCall["WolframLibraryData_new", {"WolframLibraryVersion"}]]],
      CCall["Initialize_compute", {"libData"}],
      CCall["compute", {"libData", "num1", CAddress["num2"]}],
      CCall["printf", {CString["%5.2f\n"], "num2"}],
      CCall["WolframLibraryData_free", {"libData"}],
      CReturn[0]}]]
   ];
cStr = ToCCodeString[code]

mainSource = Export[FileNameJoin[{outDir, "main.c"}], cStr, "Text"]

c = Compile[{{x}}, x^2];
CCodeGenerate[c, "compute", FileNameJoin[{outDir, "compute.c"}], 
  "CodeTarget" -> "WolframRTL"];
CCodeGenerate[c, "compute", FileNameJoin[{outDir, "compute.h"}], 
  "CodeTarget" -> "WolframRTLHeader"];

where
outDir
must be defined according the user's desires


  • The generated main.c file with a minor manual retouching in the printf function is


#include "compute.h"

#include "WolframRTL.h"


int main(int argc, char *arg[])
{
double num1 = 20.4;

double num2;
WolframLibraryData libData = WolframLibraryData_new(WolframLibraryVersion);
Initialize_compute(libData);

compute(libData, num1, &num2);
printf("%5.2f\n", num2);

WolframLibraryData_free(libData);
return 0;
}


  • The generated file compute.c is

#include "math.h"

#include "WolframRTL.h"

static WolframCompileLibrary_Functions funStructCompile;

static mbool initialize = 1;

#include "compute.h"

DLLEXPORT int Initialize_compute(WolframLibraryData libData)
{

if( initialize)
{
funStructCompile = libData->compileLibraryFunctions;
initialize = 0;
}

return 0;
}

DLLEXPORT void Uninitialize_compute(WolframLibraryData libData)
{
if( !initialize)
{

initialize = 1;
}
}

DLLEXPORT int compute(WolframLibraryData libData, mreal A1, mreal *Res)
{

mreal R0_0;
mreal R0_1;
R0_0 = A1;
R0_1 = R0_0 * R0_0;
*Res = R0_1;

funStructCompile->WolframLibraryData_cleanUp(libData, 1);
return 0;
}


  • The generated file compute .h is

#include "WolframLibrary.h"

EXTERN_C DLLEXPORT int Initialize_compute(WolframLibraryData libData);

EXTERN_C DLLEXPORT void Uninitialize_compute(WolframLibraryData libData);

EXTERN_C DLLEXPORT int compute(WolframLibraryData libData, mreal A1, mreal *Res);


  • Finally, the Makefile that takes care of the compilation is

CXX = /usr/bin/c++

MATHEMATICA_INCLUDE_PATH = /usr/local/Wolfram/Mathematica/8.0/SystemFiles/IncludeFiles/C

MATHEMATICA_LIB_PATH = /usr/local/Wolfram/Mathematica/8.0/SystemFiles/Libraries/Linux-x86-64


a.out: main.c compute.o
 ${CXX} -I${MATHEMATICA_INCLUDE_PATH} -L${MATHEMATICA_LIB_PATH} -lm -lWolframRTL -lmkl_intel_lp64 -lmkl_intel_thread -lmkl_core -liomp5 -pthread compute.o main.c

compute.o: compute.c
 ${CXX} -c -I${MATHEMATICA_INCLUDE_PATH}  -L${MATHEMATICA_LIB_PATH}  compute.c 


Of course, make sure that the libraries are in the right place and eventually you will need to add the path of the Mathematica libraries in  ld.so.conf and apply /sbin/ldconfig


  • A more elaborated example taking a real matrix input and a real matrix output is here
  • A similar example implemented for complex matrices here

Wednesday, April 20, 2011

GDP per energy consumption

Here, the world map for the GDP per unit of energy consumption. The world map has so much variation of this index that I had to make a log plot
In the case of the American continent, the linear scale is better